Estimating the CO2 of your Umbraco AI usage
5 min read
Every so often, while working on Umbraco AI, an idea pops up that’s too much fun to leave alone. This one started with a simple question while I was looking at the Analytics section: could we show the CO2 of all those agent calls?
That question has now turned into a package. Say hello to Umbraco.Community.AI.Carbon, and the beta is out now.
What it does
The package adds a CO2 tab to Umbraco AI’s Analytics section, right next to the existing Usage dashboard. It reads the usage Umbraco AI already records and turns it into an estimated energy and CO2e (carbon dioxide equivalent) figure for your AI chat usage.
That last bit matters: there’s no new tracking and no new database tables. Everything is worked out on read from the analytics Umbraco AI already keeps, so if you have usage analytics switched on (they are by default), you’ve already got everything it needs.
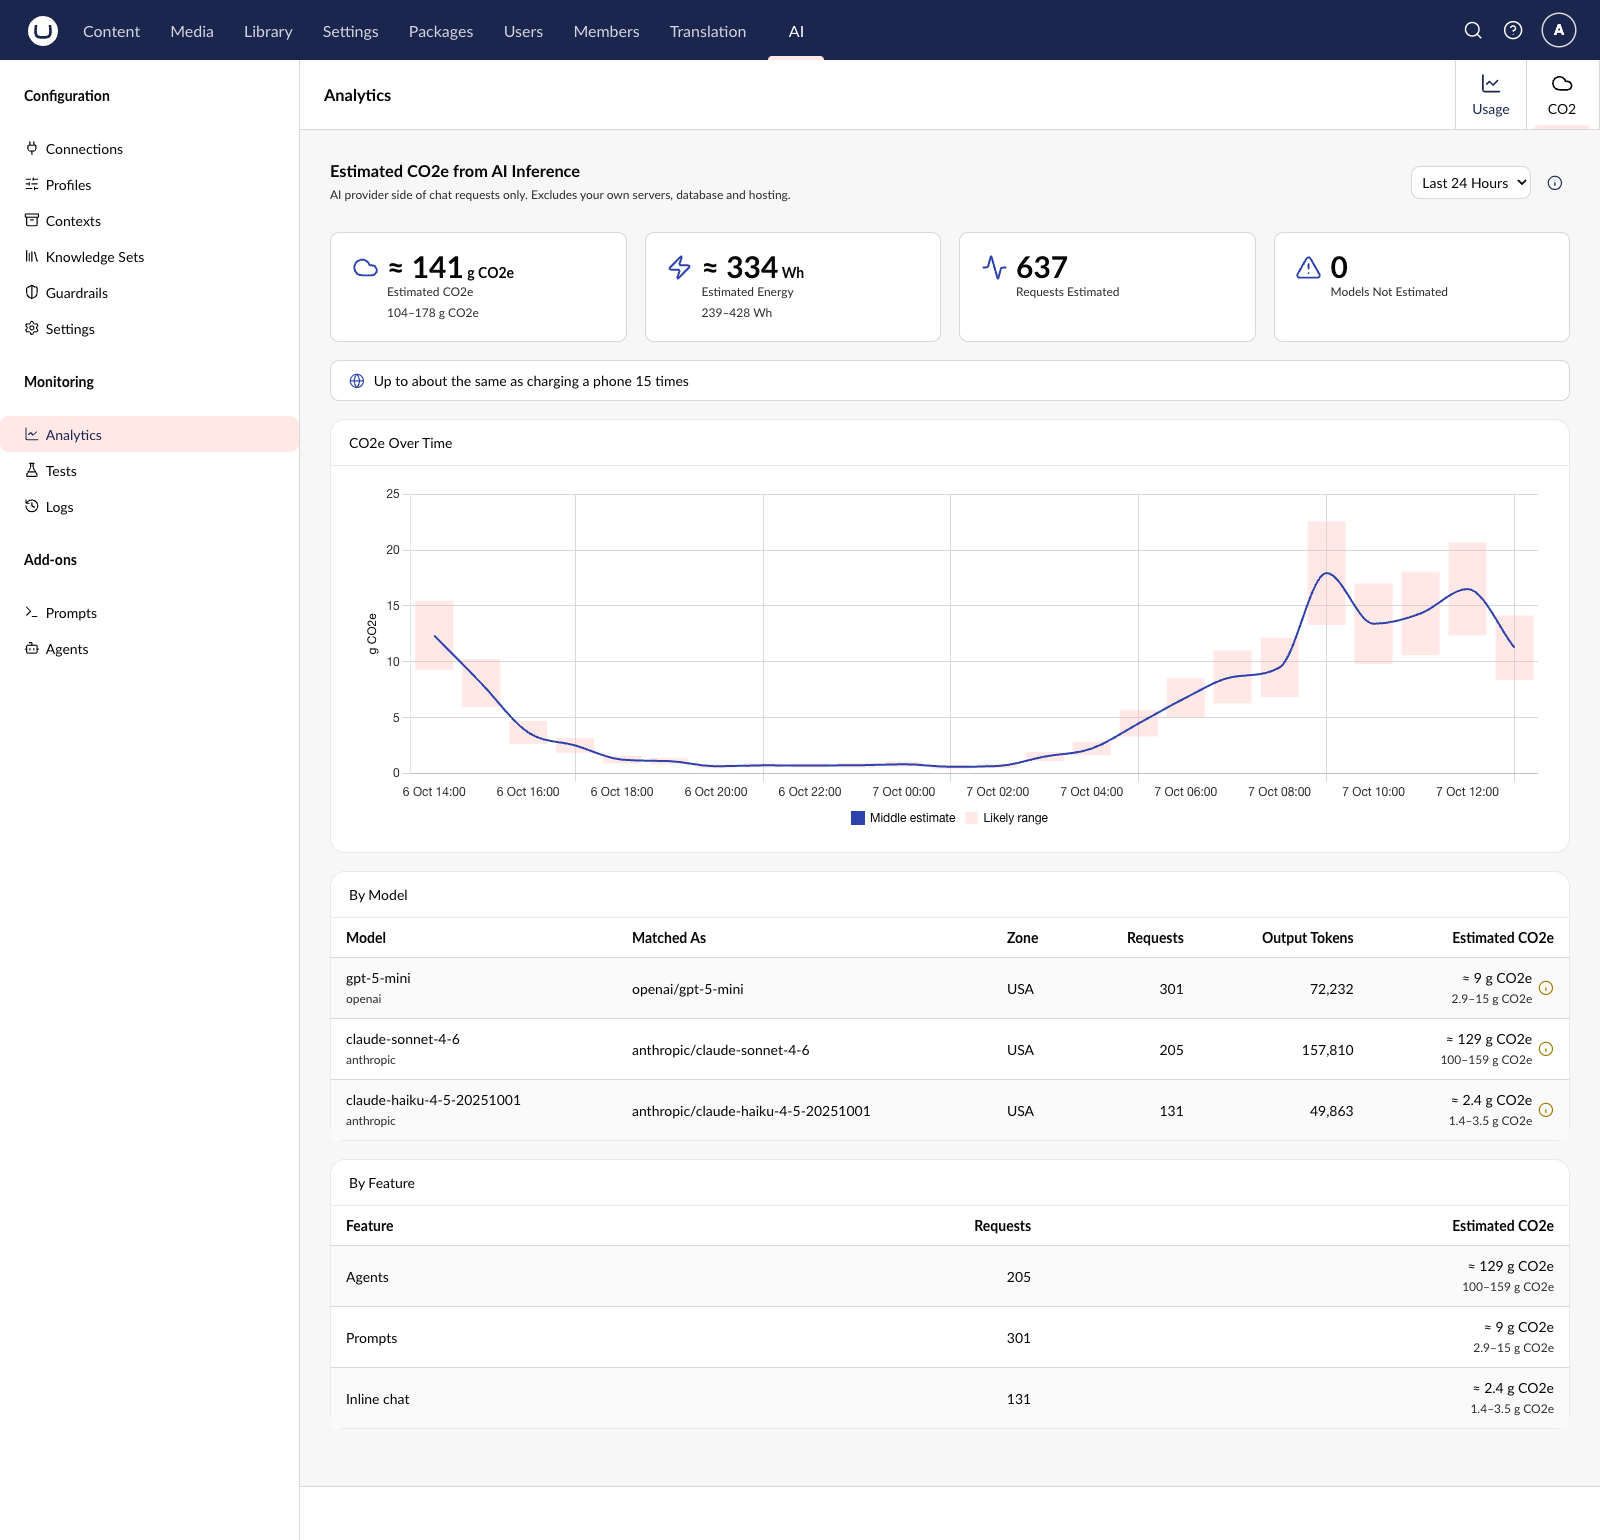
Here’s what you get:
- Estimated CO2e and energy cards. Each one leads with a rounded middle estimate (the ”≈” figure), with the low to high range shown underneath.
- An everyday comparison. Something like “Up to about the same as charging a phone 13 times”, moving on to kilometres in an average car, then short-haul flight kilometres for bigger numbers. It’s based on the top of the range, rounded up, using US EPA (October 2024) and UK DESNZ 2025 factors.
- CO2e over time. A chart with a bar for each hour or day showing the likely range, plus a smoothed line for the middle estimate.
- By model and by feature. One table breaks the estimate down by each model Umbraco AI used, the other by feature: agents, prompts, inline chat and other uses.
- A “How is this calculated?” panel. The method and the sources, in plain words, one click away.
How the estimate works
I didn’t want to invent my own maths for this, so the package uses the method and data from EcoLogits. EcoLogits is part of the CodeCarbon non-profit, was started by GenAI Impact, and is licensed under MPL-2.0.
In short, using EcoLogits’ method, the GPU and server energy for each request is worked out from the model’s size (its number of parameters) and the number of output tokens. That is multiplied by the data centre’s overhead (PUE) and the CO2e per kWh of the electricity mix, and a share of the hardware’s manufacturing footprint is added on top.
There’s no .NET version of EcoLogits, and its hosted API would mean sending your usage data off-site, so the package ships a pinned copy of the EcoLogits data and a C# port of its formula. Everything runs locally.
The honest bit
I want to be upfront here, because a CO2 number on a dashboard can look a lot more precise than it really is.
- These are estimates, and the ranges are wide. Closed models don’t publish their size, so it has to be estimated, and that uncertainty flows all the way through. That’s why every energy and CO2e figure shows a range, not just a single number.
- Only chat output is counted. Input tokens, embeddings, image generation and speech are not counted. Neither is model training, the network, your own devices, or your own servers, database and hosting.
- Models EcoLogits doesn’t know are listed as “not estimated”. They’re shown, never silently treated as zero.
- It’s unofficial. This is a community package, not an Umbraco product, and it’s not built for audit-grade or compliance reporting.
It also doesn’t make any claims about savings or offsets. It’s there to give you a rough sense of scale, not a badge.
So is it useful?
With ranges that wide, it’s fair to ask. To get a feel for it, I made a handful of real calls through a test site and looked at what came back.
- Some ranges are tight, some aren’t. Claude Sonnet 4.6 came out at 54 to 75 mg for its calls, which is fairly tight. GPT-5 mini came out at 13 to 67 mg, a five-fold spread, because EcoLogits has to allow for a much wider range of possible sizes for it.
- The gap between models is much bigger than that. Per token of output, Claude Sonnet came out at around 20 times Claude Haiku or GPT-4o mini. Even comparing the most generous end of one with the least generous end of the other, the difference doesn’t go away.
- The totals are small. My 14 test calls came to about 0.13 g of CO2e, less than charging a phone once. A busy site will see more, but “phone charges” is the honest scale.
So where I think it earns its place is in comparisons rather than exact totals. A few ways I can see it being used:
- Right-sizing a model. If your SEO description prompt runs on a large model, try switching its profile to a smaller one, check the results are still good enough, and watch the CO2 tab drop. For lots of everyday content tasks, a small model does the job.
- Finding the hotspot. The by-feature and by-model tables show where most of your footprint comes from. If one agent makes up the bulk of it, that’s the one worth looking at first, rather than trimming everything a little.
- Watching the trend. After rolling out a new AI feature to editors, the chart shows how usage, and its estimated footprint, changes from week to week.
- Answering the question. When a client asks what an AI feature costs in CO2, you can give a sourced, cautious range with the method behind it, instead of a shrug.
Try it
The beta is out now, with a version line per Umbraco major:
- 18.0.0-beta.2 for Umbraco CMS 18 and Umbraco AI 18
- 17.0.0-beta.2 for Umbraco CMS 17.4 or later and Umbraco AI 17
dotnet add package Umbraco.Community.AI.Carbon --prereleaseThen head to the AI section, open Analytics and click the CO2 tab.
Configuration
Everything is optional. Settings live in an AICarbon section in appsettings.json:
{
  "AICarbon": {
    "ElectricityZone": "SWE",
    "ShowEquivalents": false,
    "ProviderMappings": {
      "my-company-gateway": "openai"
    },
    "ModelMappings": {
      "my-gpt-deployment": "openai/gpt-4o"
    }
  }
}ElectricityZoneis an ISO 3166-1 alpha-3 country code (orWORfor the world average). When it’s left out, each model uses its provider’s default data centre location from EcoLogits. Only set it to where your models really run, because it changes the result.ShowEquivalentsis on by default; set it tofalseto hide the everyday comparison.ProviderMappingsandModelMappingslet you point custom providers, deployment names and fine-tunes at the right EcoLogits model.
If config isn’t enough, model matching is a chain of IAICarbonModelResolver implementations, so you can add your own resolver in a composer. The first one that returns a model wins, which makes it easy to slot in rules for something like a company gateway with its own naming scheme.
In Closing
It’s a beta, so I’d love to hear how it gets on with your real usage, especially any models it can’t match. Feedback, ideas and issues are all welcome over on GitHub.
Until next time 👋